MeditechFinder : Data Visualizations vol.7
概要
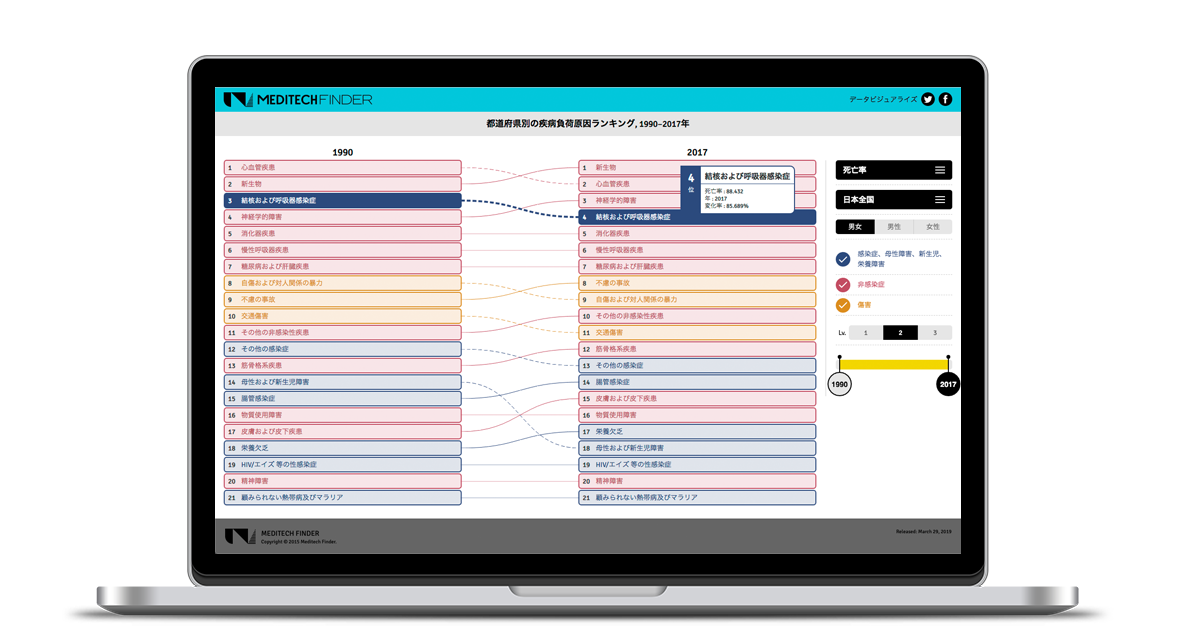
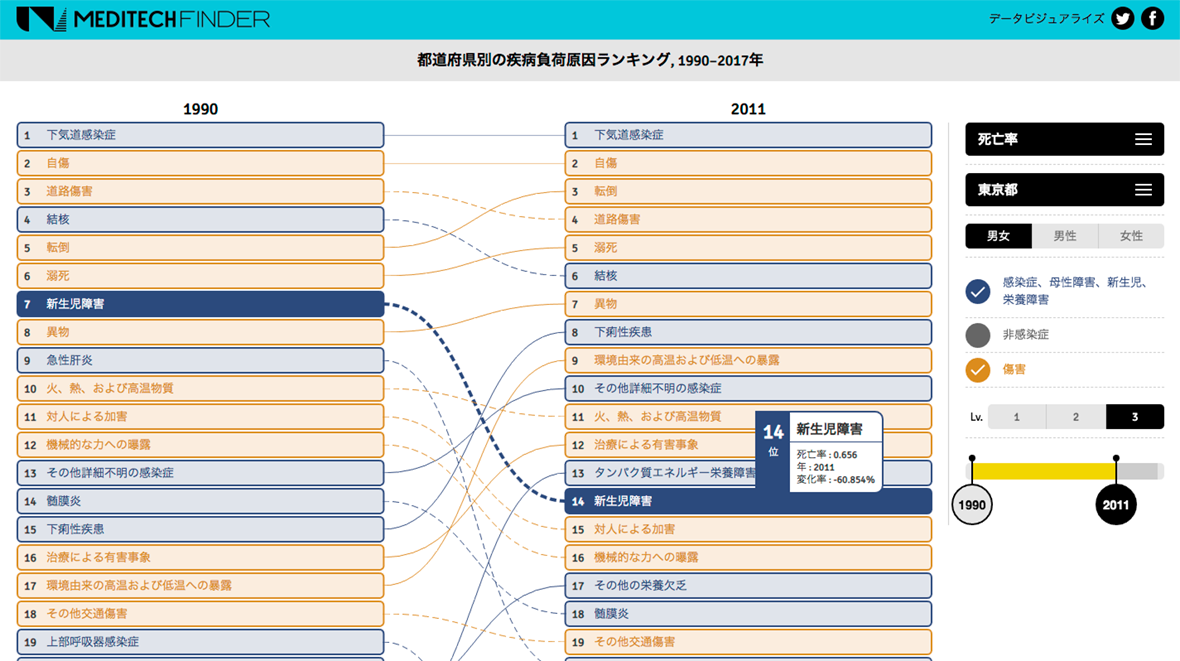
都道府県別の疾病負荷原因ランキング, 1990–2017年
1990年から2017年の日本における都道府県レベルでの原因別の疾病負荷の可視化を目的としています。都道府県別に人口10万人に対する原因別の死亡率、損失生存年数(Years of Life Lost (YLLs))、障害生存年数(Years Lived with Disability (YLDs))、障害調整生命年(Disability-Adjusted Life Year (DALYs))の4つの指標を推定し、ランキング化しました。1990年から2017年まで2時点での比較データが表示されています。

Overview
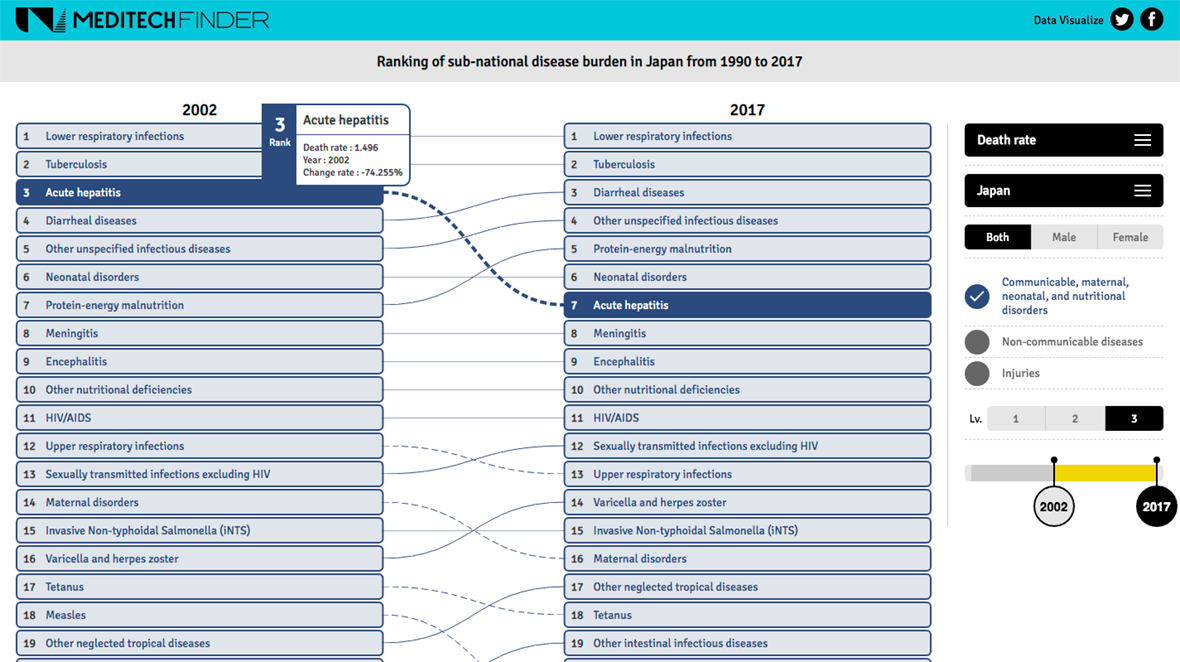
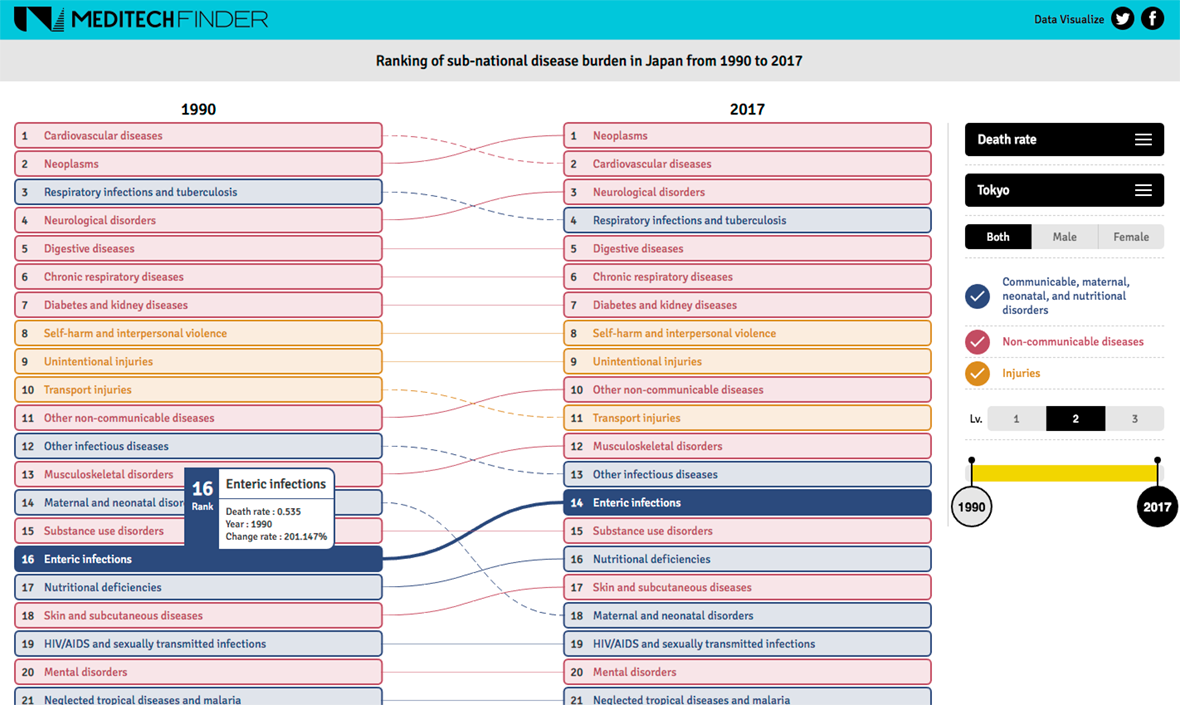
Ranking of sub-national disease burden in Japan from 1990 to 2017
This study aims to visualize the cause-specific disease burden in Japan at the prefectural level. We have analyzed and ranked the cause-specific all-age mortality rates (per 100,000 population), Years of Life Lost (YLLs), Years Lived with Disability (YLDs), and Disability-Adjusted Life Year (DALYs) per prefecture for the period 1990-2017. This visualization shows ranking of causes of these four health metrics for each prefecture. Comparative data at two time points between 1990 and 2017 are displayed.